Direct Answer: What Is 10K Age Grading and How Does It Work?
10K age grading provides a standardized mathematical method to evaluate a 10,000-meter (6.214-mile) road race performance in age- and sex-specific context by comparing your chip finish time against the demographic world-standard performance for your exact age.
Rather than claiming that a single finish time represents absolute running ability across all demographics, age grading recognizes that cardiovascular capacity, maximum oxygen uptake ((VO_2) max), and musculoskeletal recovery decline predictably as we grow older. By indexing your net chip time against World Masters Athletics (WMA) road standards, age grading produces an objective percentage score between 0% and 100%+.
A score of 50% to 59% reflects an average active recreational runner; 60% to 69% marks a competitive local club participant; 70% to 79% represents regional-class capability; and 80%+ indicates national-class masters mastery. To evaluate your own 10K road race immediately, launch our verified Age Grading Calculator.
Typical regular runner. Consistent weekly mileage, comfortable completing 10K road events and community challenges.
Dedicated competitor. Regular structured speed and tempo sessions; finishes in the top third of open road race fields.
High-level endurance athlete. Frequently contends for age-group podiums and regional road championship distinctions.
What Does 10K Age Grading Mean?
To understand 10K age grading, it helps to distinguish between your raw 10K time and your age-graded result:
- Raw 10K Finish Time: If your chip records 52:00 at the finish line, that number simply reflects how many minutes and seconds elapsed while running 10 kilometers. It tells you the absolute physical speed achieved on that specific course.
- Age-Graded Percentage: That same 52:00 finish time represents very different physiological achievements depending on who ran it. If run by a 24-year-old male, 52:00 represents approximately 50.77% (a foundational fitness effort). If run by a 50-year-old female, that identical 52:00 yields 64.90% (a competitive local club standard).
In sports science, it is vital to keep the methodology appropriately qualified. We do not say: "Age grading tells you exactly how good you are." Instead, age grading provides a standardized way to put a race performance into age- and sex-specific context.
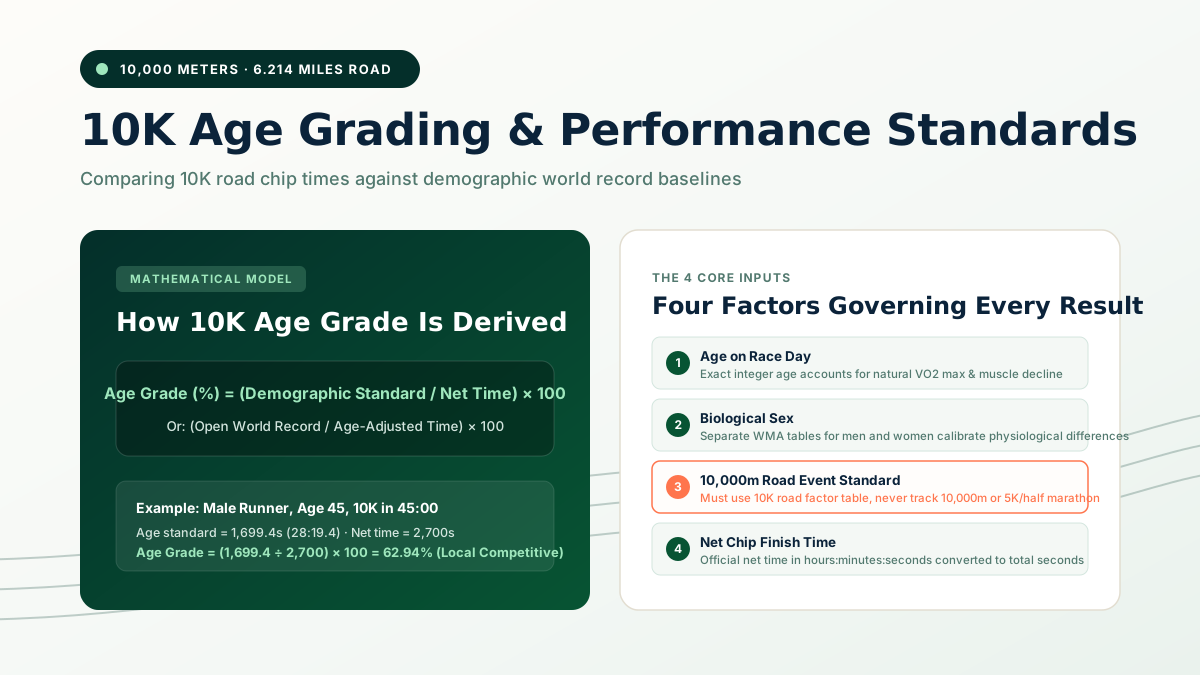
Figure: The four-stage mathematical progression from raw chip time to standardized demographic percentage.
How Does 10K Age Grading Work? The Four Core Inputs
Every age-grade calculation is governed by exactly four variables. If any single variable is altered, the resulting percentage shifts:
- Exact Age on Race Day: Age grading does not operate on rough 5-year groupings. Modern tables incorporate single-year age factors. Your biological age on the exact morning of the race is what determines your reference standard.
- Biological Sex: Physiological sex differences in hemoglobin concentration, muscle mass distribution, and lung volume require separate world benchmark standards for men and women across every age.
- Event Distance (10K Road Standard): The calculation must explicitly use the 10,000-meter road running standard, rather than a track 10,000m standard, cross-country table, or adjacent distance standard (such as 5K or half marathon). Road standards account for typical road topography and surface friction.
- Net Chip Finish Time: Your actual net chip time (from passing the start sensor to crossing the finish mat) is converted into total seconds. Clock math errors (such as using gun time instead of chip time) will artificially distort the calculated score.
Current 2025 road-running tables published by World Masters Athletics (WMA) and USATF provide verified single-age data for every road distance from 5K to the marathon. This is why calculators should explicitly identify which dataset version powers their algorithms.
How Is a 10K Age Grade Calculated?
Depending on whether a calculator expresses its calculations through an age standard or an age factor, the mathematical derivation takes one of two equivalent forms:
The Standard Time Formula
Where Demographic Standard Time is the world-record reference time (in seconds) for a runner of your exact age and biological sex at 10,000 meters road, and Actual Net 10K Time is your official chip time in seconds.
Alternatively, many timing systems and race databases implement the calculation via an Age Factor:
The Age Factor Formula
Step 2: Age Grade (%) = (Open-Class World Standard ÷ Age-Graded Time) × 100
In this approach, the age factor (a decimal value typically between 1.0000 for peak open ages and 0.5000 or lower for advanced senior divisions) normalizes your 10K time to what you would theoretically have run during your peak biological window (ages 20 to 30).
Worked Examples: Calculating 10K Age Grade Step by Step
Rather than borrowing arbitrary figures from third-party sites, all calculations below are derived directly from the verified 2025 WMA Road Standards that power the Age Calculator Lab engine:
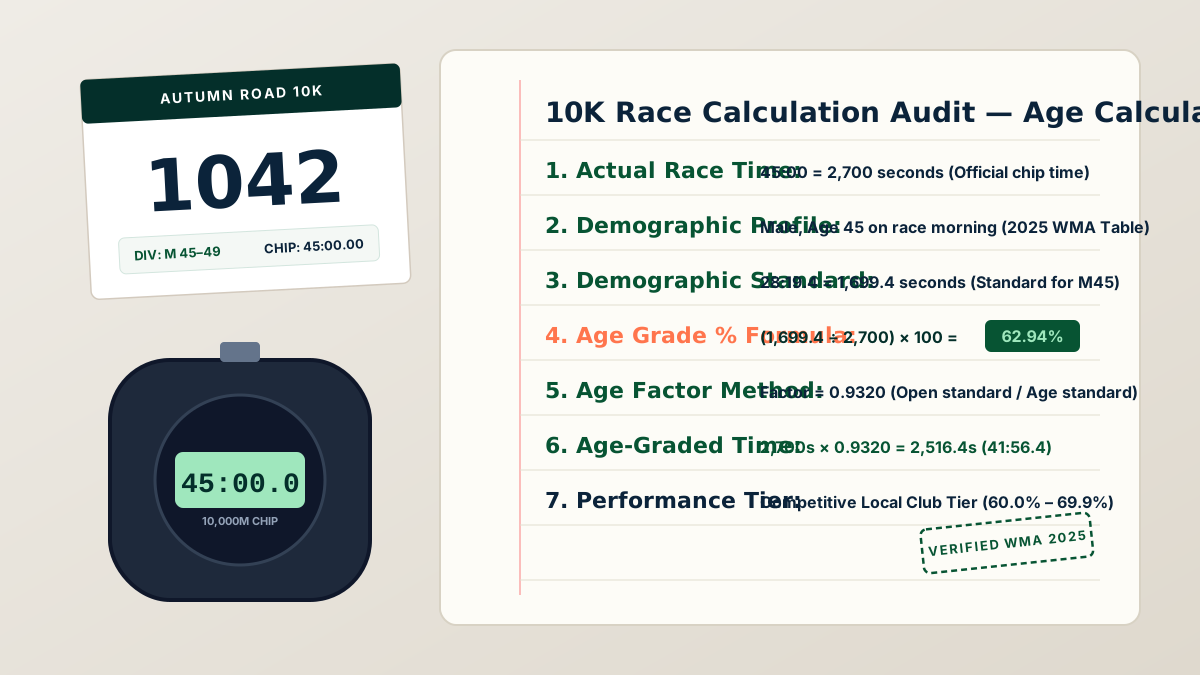
Example 1: Male Runner, Age 45, Finishing in 45:00
- Distance: 10K Road (10,000 meters)
- Input Time: 45:00 = 2,700.00 seconds
- WMA Open Benchmark: 26:24.00 (1,584.00 seconds)
- M45 Demographic Standard: 28:19.40 (1,699.40 seconds)
- M45 Age Factor: (1,584.00 div 1,699.40 approx 0.9320)
- Age Grade %: ((1,699.40 div 2,700.00) imes 100 = mathbf{62.94%})
- Age-Graded Equivalent Time: (2,700.00 imes 0.9320 = 2,516.40 ext{ seconds} = mathbf{41:56.4})
Interpretation: This 45-year-old male ran a 10K that places him firmly in the Local Competitive Club Tier (60%–69%). His performance corresponds to a theoretical open-class time of 41:56.
Example 2: Female Runner, Age 50, Finishing in 52:00
- Distance: 10K Road (10,000 meters)
- Input Time: 52:00 = 3,120.00 seconds
- WMA Open Benchmark: 29:14.00 (1,754.00 seconds)
- F50 Demographic Standard: 33:45.00 (2,025.00 seconds)
- F50 Age Factor: (1,754.00 div 2,025.00 approx 0.8662)
- Age Grade %: ((2,025.00 div 3,120.00) imes 100 = mathbf{64.90%})
- Age-Graded Equivalent Time: (3,120.00 imes 0.8662 = 2,702.54 ext{ seconds} = mathbf{45:02.5})
Interpretation: Scoring 64.90%, this runner outperforms the majority of community runners in her division, demonstrating superior aerobic preservation and pace control.
Does the Same 10K Time Mean the Same Thing at Every Age?
One of the most powerful insights of sports science is that identical raw clock times represent vastly different athletic achievements at different life stages. Consider three male runners who all cross the finish line of the same certified 10K road race in exactly 45:00:
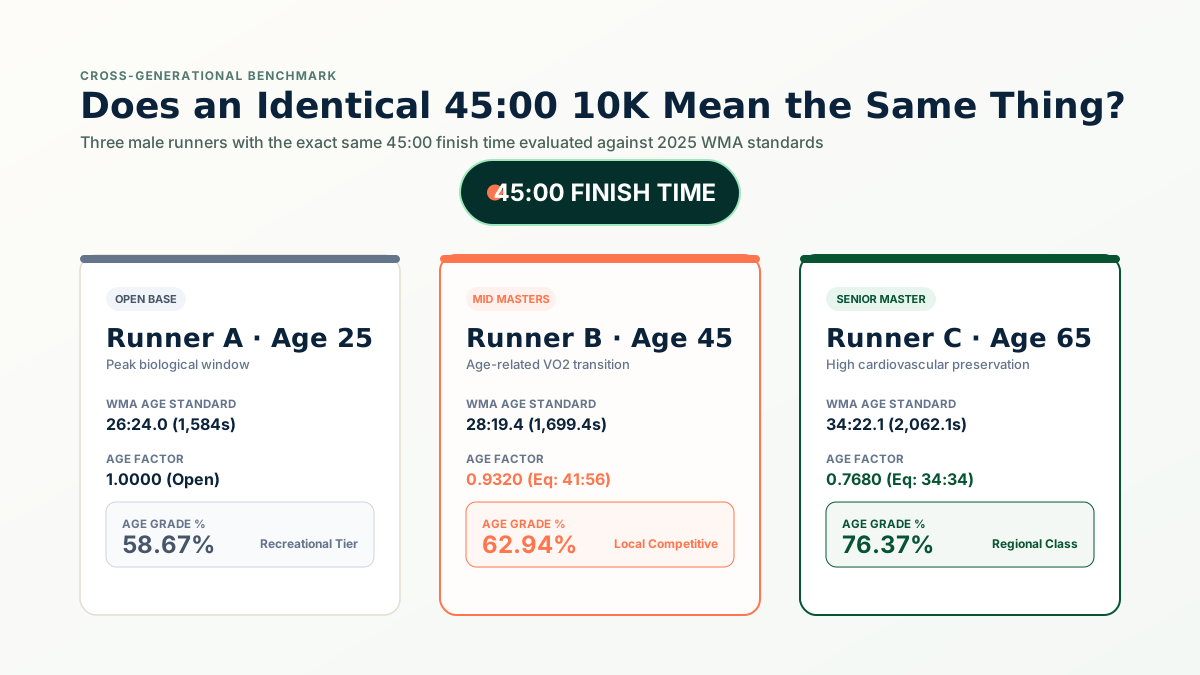
Here is why the three scores diverge so significantly:
- Age 25 (Runner A — 58.67%): At age 25, a runner is in the peak physiological endurance window where maximum stroke volume, elastic recoil, and oxygen uptake are at biological maximums. Running 45:00 represents solid fitness, but sits in the recreational tier relative to the open world record of 26:24.
- Age 45 (Runner B — 62.94%): Over two decades of biological aging, cellular mitochondrial density and cardiac output undergo gradual changes. A 45:00 clock time requires greater relative cardiovascular effort, elevating the performance into the competitive local tier.
- Age 65 (Runner C — 76.37%): At age 65, sustaining a 4:30/km (7:14/mile) pace over 10,000 meters requires remarkable physiological preservation. The age-standard baseline for 65-year-old men is 34:22.1, propelling this runner into the regional-class championship tier. On an age-graded basis, Runner C would easily claim top honors over younger runners in an age-graded road race.
10K Time vs 10K Age Grade: What Each Metric Tells You
Runners often conflate finishing time, pacing, age-graded percentage, and age-group rankings. Each metric addresses a distinct aspect of athletic evaluation:
| Metric | What It Measures | Primary Application | Limitations |
|---|---|---|---|
| 10K Finish Time | Total elapsed clock time from start to finish | Personal records, pacing checks, race qualification | Ignores biological age, sex, and course topography |
| 10K Pace (min/km or min/mi) | Average velocity across the 10,000-meter course | In-race pacing strategy and split consistency | Does not reveal demographic competitiveness |
| Age Grade Percentage (%) | Performance normalized against demographic world standards | Cross-generational comparison, multi-year fitness tracking | Does not adjust for adverse weather or hills |
| Age-Graded Time | Equivalent time adjusted to open peak competitive window | Comparing yourself directly against open-division results | Theoretical projection based on statistical models |
| Age-Group Position | Finishing order among competitors within your 5-year bracket | Podiums, ribbons, race-day medals | Heavily dependent on who happened to register for that event |
For an in-depth analysis of how age-group rankings differ from standardized percentages, explore our companion guide: Age-Graded Results vs Age-Group Results: What's the Difference?
Why 10K Is Particularly Useful for Age Grading
The 10K distance occupies a unique physiological sweet spot in distance running. While 5K races are heavily influenced by anaerobic speed reserves and marathons test glycogen depletion and muscular endurance, the 10K represents the purest test of lactate threshold and sustained aerobic power.
- Balance of Speed and Aerobic Stamina: Running 10 kilometers at threshold pace requires sustaining roughly 85% to 92% of maximum heart rate for 35 to 70 minutes. This makes the distance highly sensitive to cardiovascular condition.
- High Repeatability: Unlike the marathon—which requires months of post-race muscular recovery—a 10K race produces manageable cellular damage. Athletes can race 10K events every 4 to 6 weeks, providing frequent data points to monitor age-graded progression.
- Club & Championship Pillar: Almost every major athletics federation, club league, and community road series features a sanctioned 10K event on certified courses, creating deep, reliable datasets.
Ready to Check Your Own 10K Score?
Enter your race-day age, biological sex, and net 10K chip finish time into our verified sports-science calculator to reveal your age grade percentage and equivalent open time instantly.
Calculate Your 10K Age Grade Now →How to Use the Age Grading Calculator for a 10K
Calculating your age grade on Age Calculator Lab takes just a few seconds:
- Step 1 — Enter Race-Day Age: Type your exact integer age on the day you ran the race.
- Step 2 — Select Biological Sex: Choose Male or Female to load the corresponding WMA demographic standards.
- Step 3 — Select Distance: Choose 10K (Road) from the distance menu.
- Step 4 — Enter Finish Time: Input your official chip time in hours, minutes, and seconds (e.g., 00:45:00).
- Step 5 — Click Calculate: Hit the green button to execute the calculation against verified 2025 tables.
- Step 6 — Review Your Metrics: Examine your Age Grade Percentage, Age-Graded Time, Demographic Benchmark Time, and Performance Tier classification.
What Is a Good 10K Age Grade?
There is no arbitrary universal percentage that should automatically be labeled "good" for every individual. Age grading is most useful when comparing your own performances over time. However, running organizations and masters track bodies commonly reference the following recognized tiers:
| Age Grade Range | Performance Tier | Typical Athletic Profile |
|---|---|---|
| 90.0% – 100%+ | World Class | Contender for international masters medals and world records |
| 80.0% – 89.9% | National Class | Elite amateur; regular overall road race winner and national podium finisher |
| 70.0% – 79.9% | Regional Class | Premier club athlete; frequent age-group winner and top 5% overall finisher |
| 60.0% – 69.9% | Local Competitive | Dedicated club runner; structured interval training and consistent top-third finishes |
| 50.0% – 59.9% | Recreational Baseline | Healthy, active recreational runner with solid weekly aerobic volume |
| Under 50.0% | Novice / Fitness | Beginning runners or participants completing their first 10K milestone |
For an expanded breakdown of performance distributions, read our comprehensive guide: What Is a Good Age Grade in Running? Age Grade Percentages Explained.
Verified Male 10K Standards by Age (WMA 2025 Road Table)
The table below provides verified demographic reference standard times and sample 60% and 70% target finish times for male runners across major milestone ages:
| Age | WMA Standard Time | Age Factor | 60% Target (Club Tier) | 70% Target (Regional Tier) |
|---|---|---|---|---|
| 20 | 26:24.0 (1,584s) | 1.0000 | 44:00 | 37:42 |
| 25 | 26:24.0 (1,584s) | 1.0000 | 44:00 | 37:42 |
| 30 | 26:24.0 (1,584s) | 1.0000 | 44:00 | 37:42 |
| 35 | 26:38.8 (1,598s) | 0.9907 | 44:24 | 38:04 |
| 40 | 27:24.2 (1,644s) | 0.9634 | 45:40 | 39:09 |
| 45 | 28:19.4 (1,699s) | 0.9320 | 47:12 | 40:27 |
| 50 | 29:28.0 (1,768s) | 0.8959 | 49:06 | 42:05 |
| 55 | 30:53.0 (1,853s) | 0.8548 | 51:28 | 44:07 |
| 60 | 32:32.4 (1,952s) | 0.8113 | 54:14 | 46:29 |
| 65 | 34:22.1 (2,062s) | 0.7680 | 57:17 | 49:06 |
| 70 | 36:45.0 (2,205s) | 0.7184 | 1:01:15 | 52:30 |
| 75 | 40:12.0 (2,412s) | 0.6567 | 1:07:00 | 57:26 |
| 80 | 44:58.0 (2,698s) | 0.5871 | 1:14:56 | 1:04:14 |
Verified Female 10K Standards by Age (WMA 2025 Road Table)
The table below displays verified demographic reference standard times and target finish thresholds for female runners:
| Age | WMA Standard Time | Age Factor | 60% Target (Club Tier) | 70% Target (Regional Tier) |
|---|---|---|---|---|
| 20 | 29:14.0 (1,754s) | 1.0000 | 48:43 | 41:45 |
| 25 | 29:14.0 (1,754s) | 1.0000 | 48:43 | 41:45 |
| 30 | 29:14.0 (1,754s) | 1.0000 | 48:43 | 41:45 |
| 35 | 29:34.2 (1,774s) | 0.9886 | 49:17 | 42:14 |
| 40 | 30:35.0 (1,835s) | 0.9558 | 50:58 | 43:41 |
| 45 | 31:58.2 (1,918s) | 0.9144 | 53:17 | 45:40 |
| 50 | 33:45.0 (2,025s) | 0.8662 | 56:15 | 48:13 |
| 55 | 35:55.0 (2,155s) | 0.8139 | 59:51 | 51:18 |
| 60 | 38:32.4 (2,312s) | 0.7585 | 1:04:14 | 55:03 |
| 65 | 41:42.0 (2,502s) | 0.7010 | 1:09:30 | 59:34 |
| 70 | 45:38.0 (2,738s) | 0.6406 | 1:16:03 | 1:05:11 |
| 75 | 50:55.0 (3,055s) | 0.5741 | 1:24:51 | 1:12:44 |
| 80 | 58:05.0 (3,485s) | 0.5033 | 1:36:48 | 1:22:58 |
How to Improve Your 10K Age Grade
Improving your 10K age grade requires targeted conditioning that directly stresses your aerobic threshold and fatigue resistance:
- Targeted Lactate Threshold Tempos: Sustained intervals of 2 × 3 km or 3 × 2 miles at your current 10K pace plus 10–15 seconds per kilometer expand mitochondrial density and teach your muscles to clear lactate at race pace.
- Crucial 10K Long Runs: Building a weekly long run of 14 to 18 km ensures your muscular endurance remains robust through the critical 7th and 8th kilometers of the race.
- Negative Split Race Strategy: Running the first 5K roughly 15 to 30 seconds slower than goal pace prevents premature glycogen depletion, allowing you to surge past fatiguing competitors during the final 3 kilometers.
- Track Age Grade, Not Just Clock Time: As you navigate masters divisions, celebrate steady or rising age grades even when your clock time remains unchanged.
10K Age Grading for Masters Runners: The Power of Long-Term Tracking
For runners aged 35, 40, and beyond, raw personal records inevitably level off. However, physical fitness and athletic discipline do not vanish. Age grading provides masters athletes with a scientifically verified yardstick to evaluate lifetime performance.
Consider the longitudinal training trajectory below, tracking a male runner across a 25-year racing career from age 35 to 60:
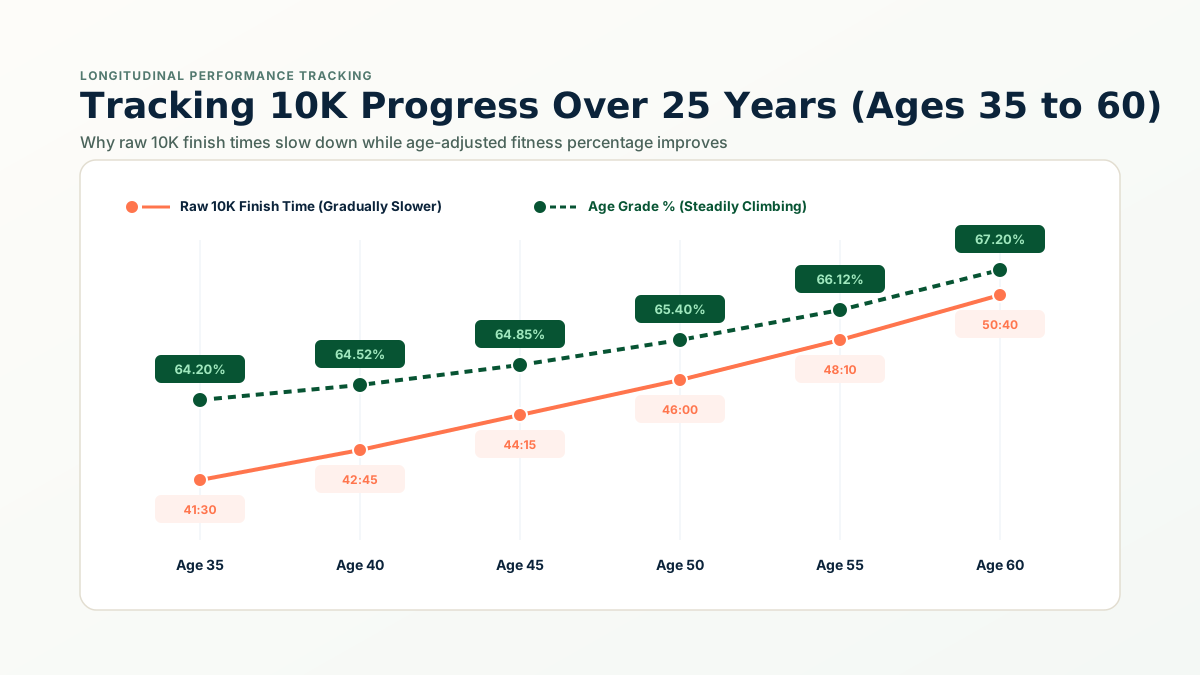
Without age grading, this runner might look at his 50:40 finish at age 60 and feel discouraged compared to his 41:30 at age 35. But with age grading, he recognizes that his 50:40 at age 60 is actually a superior athletic achievement requiring greater relative physiological dedication.
To dive deeper into training adaptations and biological aging models, read our dedicated guide: Age Grading for Masters Runners: How It Works & Why It Matters.
Does Course Difficulty Affect 10K Age Grading?
A crucial principle in running analytics is understanding the boundary between mathematical models and physical reality. Age grading calculators calculate certified horizontal distance and net chip finish time; they do not automatically adjust for course topography or environmental stress.
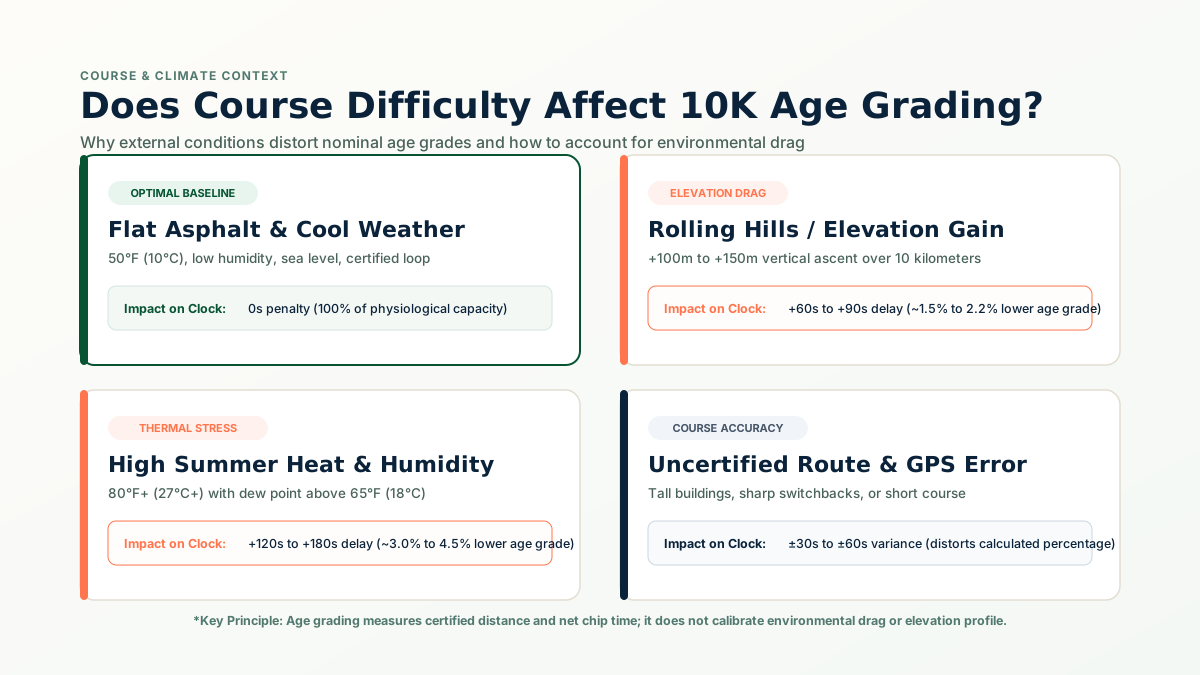
Core Takeaway: Age grading adds valuable context to a race time—it does not replace comprehensive race analysis. A 62% score achieved on a brutally hot, hilly course may represent a physiologically superior effort to a 64% score recorded on a pancake-flat course on a crisp autumn morning.
10K Age Grade vs Age-Group Result: Key Differences
Runners frequently ask why their age-graded percentage does not mirror their finishing position in the age-group standings. Here is the distinction:
- Age-Group Position: Reflects your head-to-head finish order among runners within your 5-year bracket (e.g., M45–49) who registered and raced on that specific morning. A modest time might win an age-group medal if the field is small, or finish 25th if the field is packed with regional elites.
- Age-Grade Percentage: Evaluates your performance against an unchanging global standard. Whether 50 runners or 5,000 runners participate, your 10K age grade depends solely on your chip time and demographic benchmark.
10K Age Grading vs Other Road Distances
How does your 10K age grade relate to your performances at shorter or longer race distances? Age grading provides an equitable bridge across different road events:
5K Age Grading Explained
Speed-dominant endurance. Tests VO2 max power and anaerobic tolerance. Explores Parkrun and 5K benchmarks.
10K Age Grading Explained
Lactate threshold balance. The quintessential test of sustained tempo pacing and aerobic strength.
Half Marathon Age Grading (Coming Soon)
Extended endurance. High demand for aerobic lipolysis, glycogen sparing, and progressive pacing discipline.
Marathon Age Grading (Coming Soon)
Maximum endurance challenge. Fueling strategy, physiological bonking, and muscular structural durability.
If your 10K age grade is 66% while your 5K age grade is 61%, your aerobic stamina is comparatively stronger than your raw turnover. Conversely, if your 5K age grade is 70% but your 10K age grade drops to 62%, your training will benefit from more tempo intervals and weekly volume.
Limitations of 10K Age Grading
While age grading is an exceptional performance-tracking tool, keep these practical limitations in mind:
- Standards Undergo Periodic Updates: World Masters Athletics updates road standards as global masters participation expands. Comparing an age grade calculated under 2015 tables with one calculated under 2025 tables may introduce slight variances.
- No Automatic Weather or Hill Normalization: The algorithm evaluates only distance and chip time. Severe wind, steep climbs, or extreme heat will lower your nominal percentage.
- Not an Official Prize Ranking: Unless a specific race explicitly structures its prize purse around age-graded results, official race awards are governed by physical finishing order.
- Different Calculators May Disagree Slightly: Differing interpolation methods for single-year factors between software platforms can cause minor fractions of a percentage point variance.
Methodology & Data Verification
Distance Event: 10,000-Meter Road Running (10K Road)
Governing Standards: Calibrated against verified 2025 World Masters Athletics (WMA) and USATF road-running benchmark tables approved in January 2025.
Open Benchmark Standards: Open Men: 26:24.00 (1,584s) · Open Women: 29:14.00 (1,754s).
Coverage: Single-year ages 5 through 100+ for male and female categories.
Editorial Review: Written and maintained by Navjeet Kamboj, Age Calculator Lab founder & technical lead. Last methodology audit: September 29, 2026.
Disclaimer: Age Calculator Lab is an independent performance analytics site. Age-grade outputs are provided for informational, training, and athletic-tracking purposes.
Frequently Asked Questions About 10K Age Grading
What is 10K age grading?
10K age grading is an objective scoring system that evaluates a runner's 10,000-meter road race time against the world-standard benchmark for their exact chronological age and biological sex, producing a standardized percentage score.
How is a 10K age grade calculated?
A 10K age grade is calculated by dividing the demographic standard time for your exact age and sex (established by World Masters Athletics) by your actual net finish time in seconds, then multiplying by 100.
What does my 10K age-grade percentage mean?
Your percentage indicates how closely your performance approached the world standard for your demographic. 50% to 59% represents a solid recreational fitness level, 60% to 69% marks local competitive club ability, 70% to 79% indicates regional-class performance, and 80%+ represents national-class excellence.
Does age affect 10K age grading?
Yes. Age grading specifically accounts for the natural biological changes associated with aging, including gradual reductions in maximum heart rate, VO2 max, and muscle elasticity. As age increases beyond peak competitive years, the reference benchmark time increases.
Does the same 10K time produce different age grades?
Yes. An identical finish time of 45:00 yields approximately 58.67% for a 25-year-old male, 62.94% for a 45-year-old male, and 76.37% for a 65-year-old male, reflecting the different physiological benchmarks across age brackets.
Can I calculate age grade for a 10K race?
Yes. Any accurately measured 10K road race with an official net chip finish time can be converted to an age-graded percentage and age-adjusted equivalent time using our verified calculator.
Is 10K age grading the same as age-group ranking?
No. Age-group ranking measures your physical finish position against other runners in your 5- or 10-year age bracket who showed up on race day. Age grading evaluates your time against an absolute global world standard regardless of who participated.
Why can two age-grading calculators give different results?
Different calculators utilize different editions of the World Masters Athletics (WMA) road tables (e.g., 2015, 2020, or updated 2025 standards). Small revisions to world benchmarks or mathematical smoothing formulas will produce slight variances in calculated percentages.
Does course difficulty affect age grading?
Standard age grading calculations evaluate only certified distance and net finish time. External variables such as rolling hills, summer heat, severe headwind, or sharp corners will slow your finish time and lower your nominal age grade, even though your physiological effort was maximal.
Can masters runners use 10K age grading?
Yes. Masters runners (typically age 35 or 40 and older) find 10K age grading especially valuable because it allows them to measure true training consistency and aerobic fitness preservation across decades without feeling discouraged by slower raw clock times.
Can I compare my 10K age grade over several years?
Yes, provided you evaluate results using the same underlying standards table. If your 10K finish time slows from 42:00 at age 40 to 45:00 at age 52, but your age grade remains steady at 65%, your relative aerobic performance has remained perfectly preserved.
Is an age-grade percentage an official race ranking?
Not unless a race organization explicitly incorporates age-graded awards into its official prize structure. For general road racing, official awards are governed by gun-time order of finish and 5-year chip-time age groups.
Calculate Your Official 10K Age Grade
Put your latest 10,000-meter road race time into perspective with verified 2025 WMA standards. Get your exact age-grade percentage and open equivalent time in seconds.
Launch 10K Age Grading Calculator →