
How Is Age Grade Calculated? Direct Answer
Age grade is calculated by dividing an age-and-sex-specific reference standard time by a runner's actual finishing time, then multiplying the resulting quotient by 100 to produce a percentage.
Instead of comparing runners of different generations directly on the clock, the calculation matches the athlete to an empirically derived world standard for someone of their exact chronological age and biological sex at that distance. A score of 100% represents theoretical world-record pace for that demographic, while scores in the 60%–80% range reflect competitive amateur, club, and regional racing achievements.
If you already know your age, sex, certified race distance, and chip finishing time, you can enter them into our Age Grading Calculator to instantly view your verified score.
“Age grading never adds or subtracts flat minutes from your race time. It scales your performance non-linearly using empirical decay curves. A 60-year-old running 24:00 and a 25-year-old running 20:00 might look very different on the stopwatch, but both represent an identical ~65% athletic caliber.”
How Is Age Grade Calculated?
While the overall concept of age grading was introduced in our companion guide (What Is Age Grading in Running?), understanding the mathematical machinery behind it requires looking at how raw race times are mapped to standardized biological baselines.
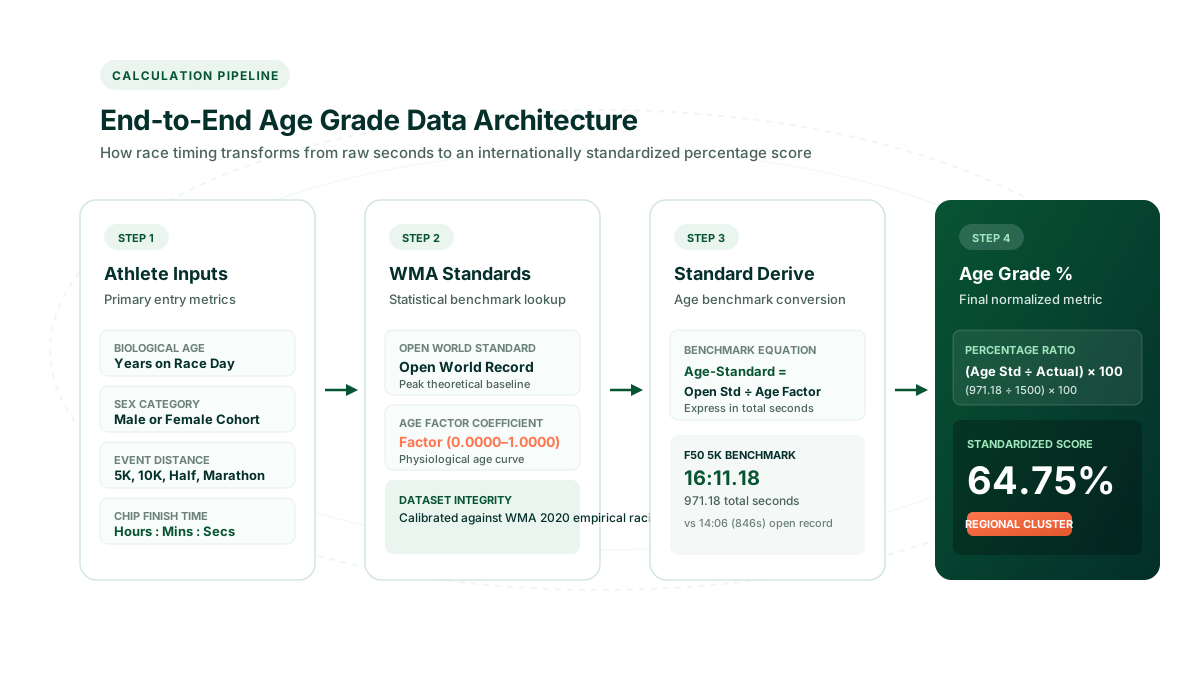
The calculation sequence follows seven sequential stages:
- Identify the runner's exact chronological age on the day the race took place.
- Identify the applicable sex category (Male or Female standards).
- Identify the certified race event and distance (such as 5K, 10K, Half Marathon, or Marathon).
- Record the runner's actual chip performance converted cleanly into decimal seconds.
- Retrieve the applicable demographic reference standard from verified tables (such as World Masters Athletics).
- Compare the runner's actual performance with the reference benchmark by computing their mathematical ratio.
- Express the ratio as a standardized percentage, rounded to two decimal places.
Conceptual Calculation Formula
For time-based racing events where shorter duration represents superior athletic performance.
Important Methodology Note
The equation above represents the core conceptual architecture of time-based age grading. The exact numerical factors, curve interpolations, event distance conversions, and reference records applied in production depend on the specific statistical dataset utilized by the scoring software (such as WMA 2020 or WMA 2025 tables).
What Information Is Needed to Calculate Age Grade?
To compute an objective age-grade percentage, a calculator requires five pieces of verified data. Missing even one input makes an accurate calculation impossible because the performance curves are multi-dimensional.
| Required Input | Measurement Unit | Why It Matters to the Calculation |
|---|---|---|
| Runner's Age | Completed years on race day | Determines the single-year age group factor and applicable physiological decay curve. |
| Sex Category | Male / Female | Selects the gender-specific reference dataset reflecting physiological baseline differences in aerobic capacity. |
| Event / Distance | Meters, Kilometres, or Miles | Establishes the open world standard and distance-specific pacing requirements. |
| Actual Finish Time | Hours, Minutes, Seconds | Represents the denominator in the equation: the athlete's true recorded chip duration. |
| Reference Standard | Total decimal seconds | The theoretical world-standard baseline (numerator) derived from empirical masters championship records. |
Step-by-Step: How to Calculate Age Grade
Let us walk through each step of the calculation in detail, examining how modern sports-science systems process athlete information.
Determine the Runner's Age on Race Day
Age grading relies on the runner's exact age on the day of competition, not their age at the beginning of the calendar year or when they registered for the event. In World Masters Athletics (WMA) protocols, age factors are defined in single-year increments (e.g., age 48 has a distinct factor from age 49). If a runner turns 50 on Saturday and races on Sunday, their performance is evaluated under the age 50 standard.
Select the Sex Category
Age-grading tables provide separate reference standards for male and female competitors. These tables account for well-documented biological differences in hemoglobin concentration, muscle mass distribution, stroke volume, and VO2 max decline rates across the lifespan.
Identify the Specific Running Event
Each distance features its own physiological energy profile and world standard. Standard recognized distances include the 1 Mile, 5K road, 10K road, Half Marathon (21.0975 km), and Marathon (42.195 km). Track events (such as the 5,000m track) have dedicated reference times separate from road courses because track surfaces generally yield slightly faster times.
Convert Actual Finish Time into Total Seconds
Stopwatches measure time in hours, minutes, and seconds, but arithmetic requires a single numeric unit. The actual time is converted to decimal seconds:
Total Seconds = (Hours × 3600) + (Minutes × 60) + Seconds
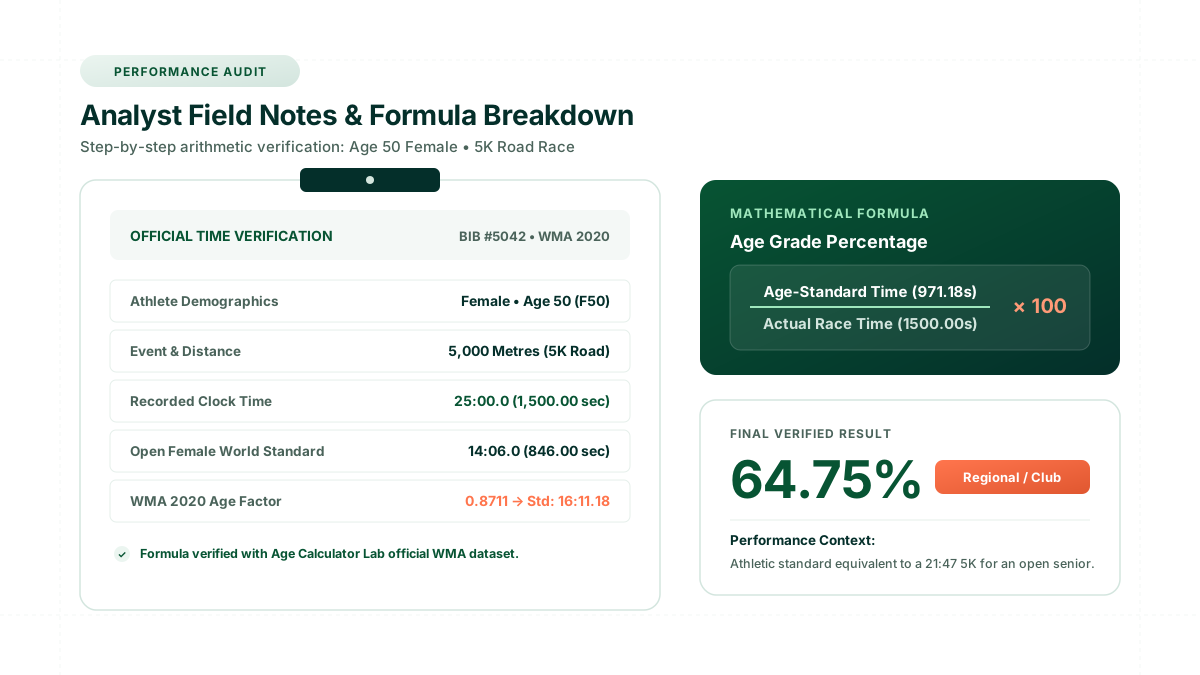
For instance, a chip time of 25:00 converts to (25 × 60) = 1,500.00 seconds.
Retrieve the Age-Adjusted Reference Benchmark
The calculation engine queries the verified dataset. In WMA-based systems, this is determined by taking the Open World Standard for that event and dividing it by the runner's single-year Age Factor (or multiplying by an age-specific time standard). This produces the benchmark time in seconds that a world-record caliber runner of that exact age and sex would achieve.
Calculate the Ratio of Benchmark to Actual Performance
Because running is a time-based sport where less time equals greater speed, the age standard serves as the numerator and the athlete's actual time serves as the denominator. Dividing standard seconds by actual seconds produces a decimal ratio between 0.0 and 1.0 (or greater than 1.0 in world-record breaking performances).
Multiply by 100 to Express the Age Grade Percentage
Multiplying the decimal ratio by 100 converts the quotient into an intuitive percentage score. The score is typically formatted to two decimal places (e.g., 64.75%). A higher percentage indicates that the runner was closer to the pinnacle demographic baseline.
The Age Grading Formula Explained
In international running analytics, there are two mathematically equivalent ways to formulate age grading. Understanding both helps clarify how different race timing software and platforms calculate their scores.
Method A: Standard Time Ratio
This is the classic formulation where an age-adjusted standard time is computed first:
Method B: WMA Age Factor Formulation
The World Masters Athletics (WMA) scoring committee publishes demographic factors (ranging from 1.0000 down to ~0.3000 as age increases). In this formulation, the runner's actual time is first multiplied by the age factor to produce an "age-leveled open equivalent time," which is then compared against the open world record:
Because Age Standard = Open World Record ÷ Age Factor, both equations produce the exact same final percentage score when calculated with full precision.
| Formula Variable | Definition & Role | Example Value (F50 5K) |
|---|---|---|
| Open World Standard (OWS) | The baseline theoretical world record for an open senior athlete (ages 20–34) | 14:06.00 (846.00 seconds) |
| WMA Age Factor (F) | Empirical coefficient modeling biological capacity at that single year of age | 0.8711 |
| Age Standard Time (AST) | Demographic world benchmark for that exact age and sex cohort | 16:11.18 (971.18 seconds) |
| Actual Time (AT) | The runner's certified chip finish time | 25:00.00 (1,500.00 seconds) |
| Age-Adjusted Equivalent (AAE) | The equivalent time the runner would have clocked during their physical prime | 21:46.65 (1,306.65 seconds) |
Age Grade Calculation Example: Complete Worked Walkthrough
To demonstrate the formula in practice, let us examine a real-world scenario verified against our production calculator engine.
Runner Case Study: 50-Year-Old Female, 5K Road Race
Verified WMA 2020Input Parameters:
Mathematical Execution:
(25 × 60) + 00 = 1,500.00 seconds
14:06.00 = 846.00 seconds
Factor = 0.8711
846.00 ÷ 0.8711 = 971.18 seconds (16:11.18)
971.18 ÷ 1500.00 = 0.647453...
0.647453... × 100 = 64.75%
1500.00 × 0.8711 = 1,306.65s (21:46.65)
This worked example illustrates the power of age grading. While a 25:00 5K may place in the middle of a mass-participation road race, in the context of biological aging, this 50-year-old athlete produced a performance mathematically equivalent to an open-division senior clocking an elite club-level 21:47.
How Does Age Affect Age Grade?
A common misconception among newer runners is that age grading subtracts a flat number of seconds for every year lived (such as "subtracting 5 seconds per year after age 35"). In reality, biological aging is non-linear, and the WMA reference curves reflect this biological reality.
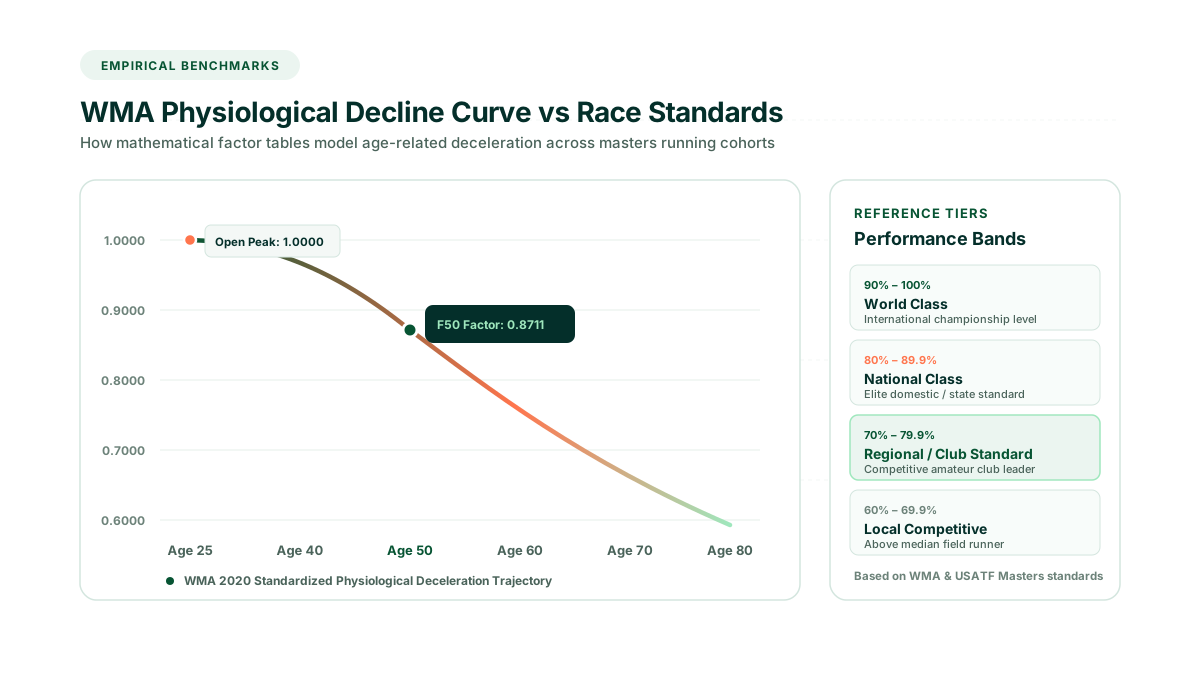
Between ages 20 and 34, age factors hover at or very close to 1.0000 because human aerobic capacity and muscular elasticity peak during this physical maturity window. Beyond age 35, the decline begins gradually, decelerating at approximately 0.5% to 0.7% per year through one's 40s.
However, between ages 55 and 75, the physiological curve steepens due to cumulative reductions in maximal cardiac output, capillary density, and muscle fiber cross-sectional area. As a result, the factor declines more rapidly each year. Because the denominator is scaled by this steeper curve, older runners receive progressively greater compensation for every second on the clock.
| Runner Age (Female 5K) | WMA 2020 Factor | Age Benchmark Standard | 25:00 Finish Yields Age Grade |
|---|---|---|---|
| Age 25 (Open Senior) | 1.0000 | 14:06 (846.00s) | 56.40% (Recreational) |
| Age 40 (Masters) | 0.9632 | 14:38 (878.32s) | 58.55% (Recreational) |
| Age 50 (Senior Masters) | 0.8711 | 16:11 (971.18s) | 64.75% (Club Standard) |
| Age 60 (Grand Masters) | 0.7784 | 18:06 (1,086.84s) | 72.46% (Regional Class) |
| Age 70 (Veteran Masters) | 0.6857 | 20:33 (1,233.78s) | 82.25% (National Class) |
As demonstrated in the table above, the exact same 25:00 clock time shifts from a 56.40% recreational run at age 25 into an extraordinary 82.25% National Class achievement at age 70.
Does Sex Affect Age Grade?
Yes. Human physiology exhibits distinct differences in natural body composition, essential fat percentages, lung capacity, and average hemoglobin mass between biological sexes. World record performances across every recognized running distance reflect these baseline differences.
For instance, in the 5K road race, the open world baseline for men is approximately 12:49 (769 seconds), whereas the open baseline for women is approximately 14:06 (846 seconds). Age-grading systems maintain completely independent tables for men and women.
Crucially, this independence ensures that male and female scores can be compared directly against each other on a single, unified leaderboard. If a 45-year-old male scores 71.50% and a 52-year-old female scores 73.20% in the same race, the female runner achieved the superior performance relative to her biological potential, regardless of who crossed the timing mat first.
How Does Race Distance Affect Age Grade?
Different running events engage completely different energetic pathways. A 1 Mile race draws significantly on anaerobic glycolysis and explosive power, whereas a Marathon depends almost entirely on oxidative phosphorylation, glycogen conservation, and fat oxidation efficiency.
Because human masters runners experience changes in sprint power and endurance at different rates, WMA maintains dedicated mathematical tables for every certified race distance.
| Racing Event | Certified Distance | Physiological Focus & Demand | WMA Standard Basis |
|---|---|---|---|
| 1 Mile | 1,609.34 meters | VO2 max, anaerobic capacity, neuromuscular turnover | Road Mile standards |
| 5K | 5,000 meters | High-aerobic threshold and lactate tolerance | Road 5K certified course standard |
| 10K | 10,000 meters | Sustained aerobic power and tempo stamina | Road 10K certified course standard |
| Half Marathon | 21,097.5 meters | Aerobic economy, fat oxidation, endurance pacing | Road 21.1 km championship benchmark |
| Marathon | 42,195.0 meters | Metabolic efficiency, glycogen storage, muscular endurance | Certified 42.2 km road marathon standard |
Why Reference Standards Matter
An age-grade percentage is not an absolute law of physics; it is a statistical ratio whose accuracy depends entirely on the quality and integrity of the reference dataset behind it.
If a calculator uses outdated records from 1994, runners will be compared against historical standards that have since been superseded by modern training, nutrition, and advanced footwear technology. Conversely, if a calculator uses arbitrary formulas without empirical grounding, the percentages become meaningless vanity metrics.
Age Calculator Lab: Calculation Engine & E-E-A-T Standards
Official Reference Source: World Masters Athletics (WMA) Road Standards, developed in collaboration with USA Track & Field (USATF).
Dataset Edition: WMA 2020 Tables (with current 2025/2026 record calibrations).
Interpolation Engine: Single-year discrete factor matching with full floating-point precision.
Audit Frequency: Verified annually following WMA Congress updates.
Why Can Two Age Grading Calculators Give Different Results?
Runners frequently notice that entering the same finish time into two different websites yields slightly different percentages—for instance, 64.75% on one site and 65.10% on another. Before assuming that one tool is broken, check the five technical factors that cause these variations:
- Different Dataset Editions: World Masters Athletics updates its factor tables periodically (major releases include 2006, 2010, 2015, and 2020). Tools running older tables will produce different scores than those using the latest standards.
- Track vs. Road Standards: A 5,000m track race and a 5K road race have slightly different world records because road courses include turns, weather exposure, and surface variations. Some calculators use track tables for road races.
- Age Reckoning Conventions: Some older scoring engines group runners into broad five-year brackets (e.g., all runners aged 50–54 receive the age 50 factor), whereas modern tools calculate precise single-year factors.
- Rounding of Intermediate Decimal Seconds: Converting time to seconds and dividing standard times can produce infinite repeating decimals. Whether a calculator rounds intermediate values or preserves full precision affects the final hundredth of a percent.
- Baseline World Record Updates: When an open world record is broken (such as in the marathon), the theoretical baseline increases, which slightly lowers the percentage for all other runners under updated tables.
How Does an Age Grading Calculator Work?
Behind the scenes, a high-precision age grading calculator operates as an automated data processing engine. When you submit your details on Age Calculator Lab, the application executes the following pipeline in milliseconds:
- Input Sanitization & Validation: The script checks that age is within biological bounds (typically ages 5 to 100), verifies that hours, minutes, and seconds are valid integers, and ensures distance is recognized.
- Time Normalization: Hours and minutes are converted to seconds:
(hh × 3600) + (mm × 60) + ss. - Relational Table Lookup: The engine indexes the pre-compiled WMA dataset using an exact composite key:
[distance_code + '_' + sex + '_' + age]. - Ratio Computation: The standard baseline seconds are divided by the runner's seconds and multiplied by 100.
- Equivalent Open Time Derivation: The runner's time is multiplied by the age factor to display what their time equates to for a 25-year-old senior.
- TOC Classification Assignment: The percentage is mapped to standard athletic tiers (World Class, National, Regional, Local Competitive, or Recreational).
How to Calculate Your Age Grade Using Our Calculator
Calculating your score takes less than ten seconds on Age Calculator Lab:
- Navigate to the Age Grading Calculator.
- Enter your exact age on race day.
- Select your biological sex category (Male or Female).
- Choose your certified event distance from the dropdown menu (e.g., 5K, 10K, Half Marathon, Marathon).
- Type in your chip finish time in Hours, Minutes, and Seconds.
- Click Calculate Age Grade to view your percentage, equivalent open time, and performance tier.
What Does Your Age Grade Percentage Mean?
Once you have your calculated percentage, how should you interpret it? International athletics governing bodies, including WMA and USATF, categorize age-grade percentages into five widely recognized performance tiers:
| Age Grade Range | Recognized Athletic Classification | Competitive Context |
|---|---|---|
| 90.00% – 100%+ | World Class | Elite international competitors, world championship contenders, and world record pace. |
| 80.00% – 89.99% | National Class | Top-tier domestic athletes capable of qualifying for national championships and winning major events. |
| 70.00% – 79.99% | Regional / Club Standard | Highly competitive amateur runners who consistently place near the top of local age-group categories. |
| 60.00% – 69.99% | Local Competitive | Dedicated runners performing well above median field averages with consistent structured training. |
| Below 60.00% | Recreational / Personal Fitness | Runners focused on general aerobic health, completing races, and pursuing individual milestone improvements. |
To understand what your calculated percentage means in competitive terms and how to interpret performance tiers like 50%, 60%, 70%, 80%, or 90%, read our detailed companion guide: What Is a Good Age Grade in Running?. For an introductory overview of the scoring concept and history, explore What Is Age Grading in Running?.
Age Grade vs Race Time: Understanding the Metrics
Every runner tracks multiple metrics throughout a racing calendar. It is helpful to view age grading alongside traditional timing statistics to understand what each measure communicates:
| Metric | What It Measures | Strengths | Limitations |
|---|---|---|---|
| Race Finish Time | Raw elapsed duration between start and finish mats. | Objective, universal, determines race winners on the day. | Ignores age, sex, and physiological potential. |
| Pace (min/km or min/mi) | Average speed sustained over distance. | Crucial for tactical race execution and splits. | Does not reveal biological effort or longevity. |
| Age Grade Percentage | Performance relative to demographic world standards. | Levels playing field across all ages and sexes; enables multi-year progress tracking. | Does not account for course elevation, hills, or extreme weather. |
| Age-Group Ranking | Placement within a 5-year or 10-year bracket on race day. | Provides podium recognition and awards. | Heavily skewed by who happened to register for that specific race. |
Limitations of Age Grade Calculations
While age grading is the most robust comparative tool in modern athletics, runners should keep its limitations in mind when evaluating their race results:
- Course Topography & Elevation: WMA standards are modeled on flat, certified courses. Running a 5K with 200 meters of vertical hill climbing will produce a slower clock time and a lower age grade, despite requiring greater physiological effort.
- Environmental Conditions: Extreme heat, high humidity, headwind, and altitude significantly impair aerobic performance. Age-grade algorithms do not adjust for weather factors.
- Course Certification: If a local course is accidentally 150 meters long or short, your calculated age grade will be distorted. Official age grading is valid only on accurately measured USATF/World Athletics certified courses.
- Medical & Fitness Boundary: Age grading is strictly an athletic race-performance comparison tool. It does not measure clinical cardiovascular health, metabolic markers, blood pressure, or general longevity.
Frequently Asked Questions
What is the formula for age grading?
The core conceptual formula is: Age Grade (%) = (Applicable Reference Standard Time ÷ Actual Finish Time) × 100. In systems using World Masters Athletics factor tables, this is calculated as: Age Grade (%) = (Open World Record ÷ (Actual Race Time × Age Factor)) × 100.
How do you calculate age grade in running?
You identify your exact age on race day, select your sex and certified event distance, convert your finish time into total seconds, find your age benchmark from certified WMA tables, divide benchmark seconds by actual finish seconds, and multiply by 100.
What information is needed to calculate age grade?
You need four primary inputs: your exact age on race day, your biological sex, the certified race distance (such as 5K, 10K, or Marathon), and your chip finish time. The calculator provides the fifth required element: the verified reference standard.
Does age affect age grading?
Yes. Age determines the exact mathematical factor applied to your time. Because human aerobic performance naturally declines over time, older runners have higher benchmark standard times, enabling them to achieve higher age-grade percentages with slower finish times.
Does sex affect age grading?
Yes. Separate reference tables exist for male and female runners, reflecting established biological baselines in aerobic capacity and historical world records. This allows men and women of different ages to compete fairly on a single combined leaderboard.
Why do age-grading calculators show different percentages?
Calculators can produce slight discrepancies if they use different editions of WMA tables (such as 2015 vs 2020), apply track standards to road races, use broad 5-year age brackets instead of single-year increments, or handle decimal second rounding differently.
Is age grade the same as race time?
No. Race time measures raw elapsed duration on the clock. Age grade is a standardized percentage that normalizes that duration for biological age and sex, expressing how close your run was to the theoretical world record for your demographic cohort.
Can I calculate my age grade online?
Yes. You can use our free, instant Age Grading Calculator on Age Calculator Lab. Simply enter your age, sex, race distance, and finish time to view your official percentage and equivalent open senior race time.
Have Your Race Time? Calculate Your Age Grade Now
Enter your age, sex, certified race distance, and chip finish time to receive an instant, mathematically verified age-grade percentage and equivalent open time.
Calculate My Age Grade →
1. World Masters Athletics (WMA) Age-Grading Performance Tables (2020 Edition & 2025/2026 revisions).
2. USA Track & Field (USATF) Masters Committee Age-Graded Scoring Tables & Technical Specifications.
3. Association of International Marathons and Distance Races (AIMS) Course Certification Standards.